Course and Processing of Aerial Thermographic Measurement
For the purpose of this report, the methodology of aerial thermographic inspection was applied, during which infrared thermal images were captured using unmanned aerial systems (drones). This enabled detailed and highly accurate measurement of the thermal characteristics of photovoltaic (PV) modules. The evaluation was performed in accordance with the requirements of
IEC TS 62446-3. The applied methodology allows for the detection of thermal anomalies and effective diagnosis of system faults from an aerial perspective, ensuring precise localization of identified defects.
Thanks to the optimization of the flight and imaging process, all data were collected within a short time frame and under homogeneous meteorological conditions (particularly constant solar irradiance). This minimized the influence of variable factors and allowed for consistent analysis of individual modules.
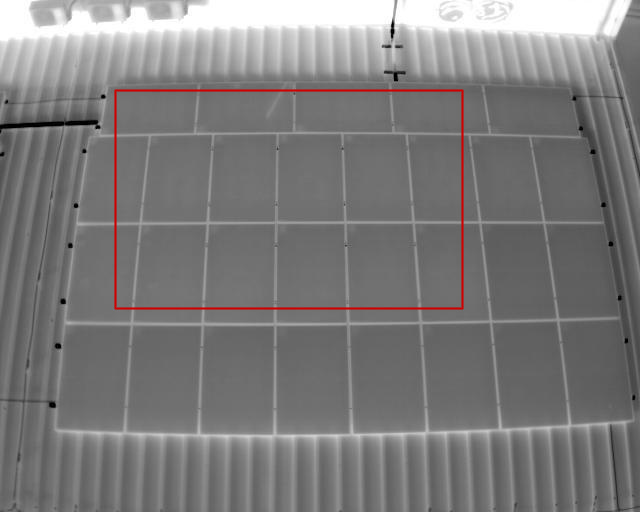
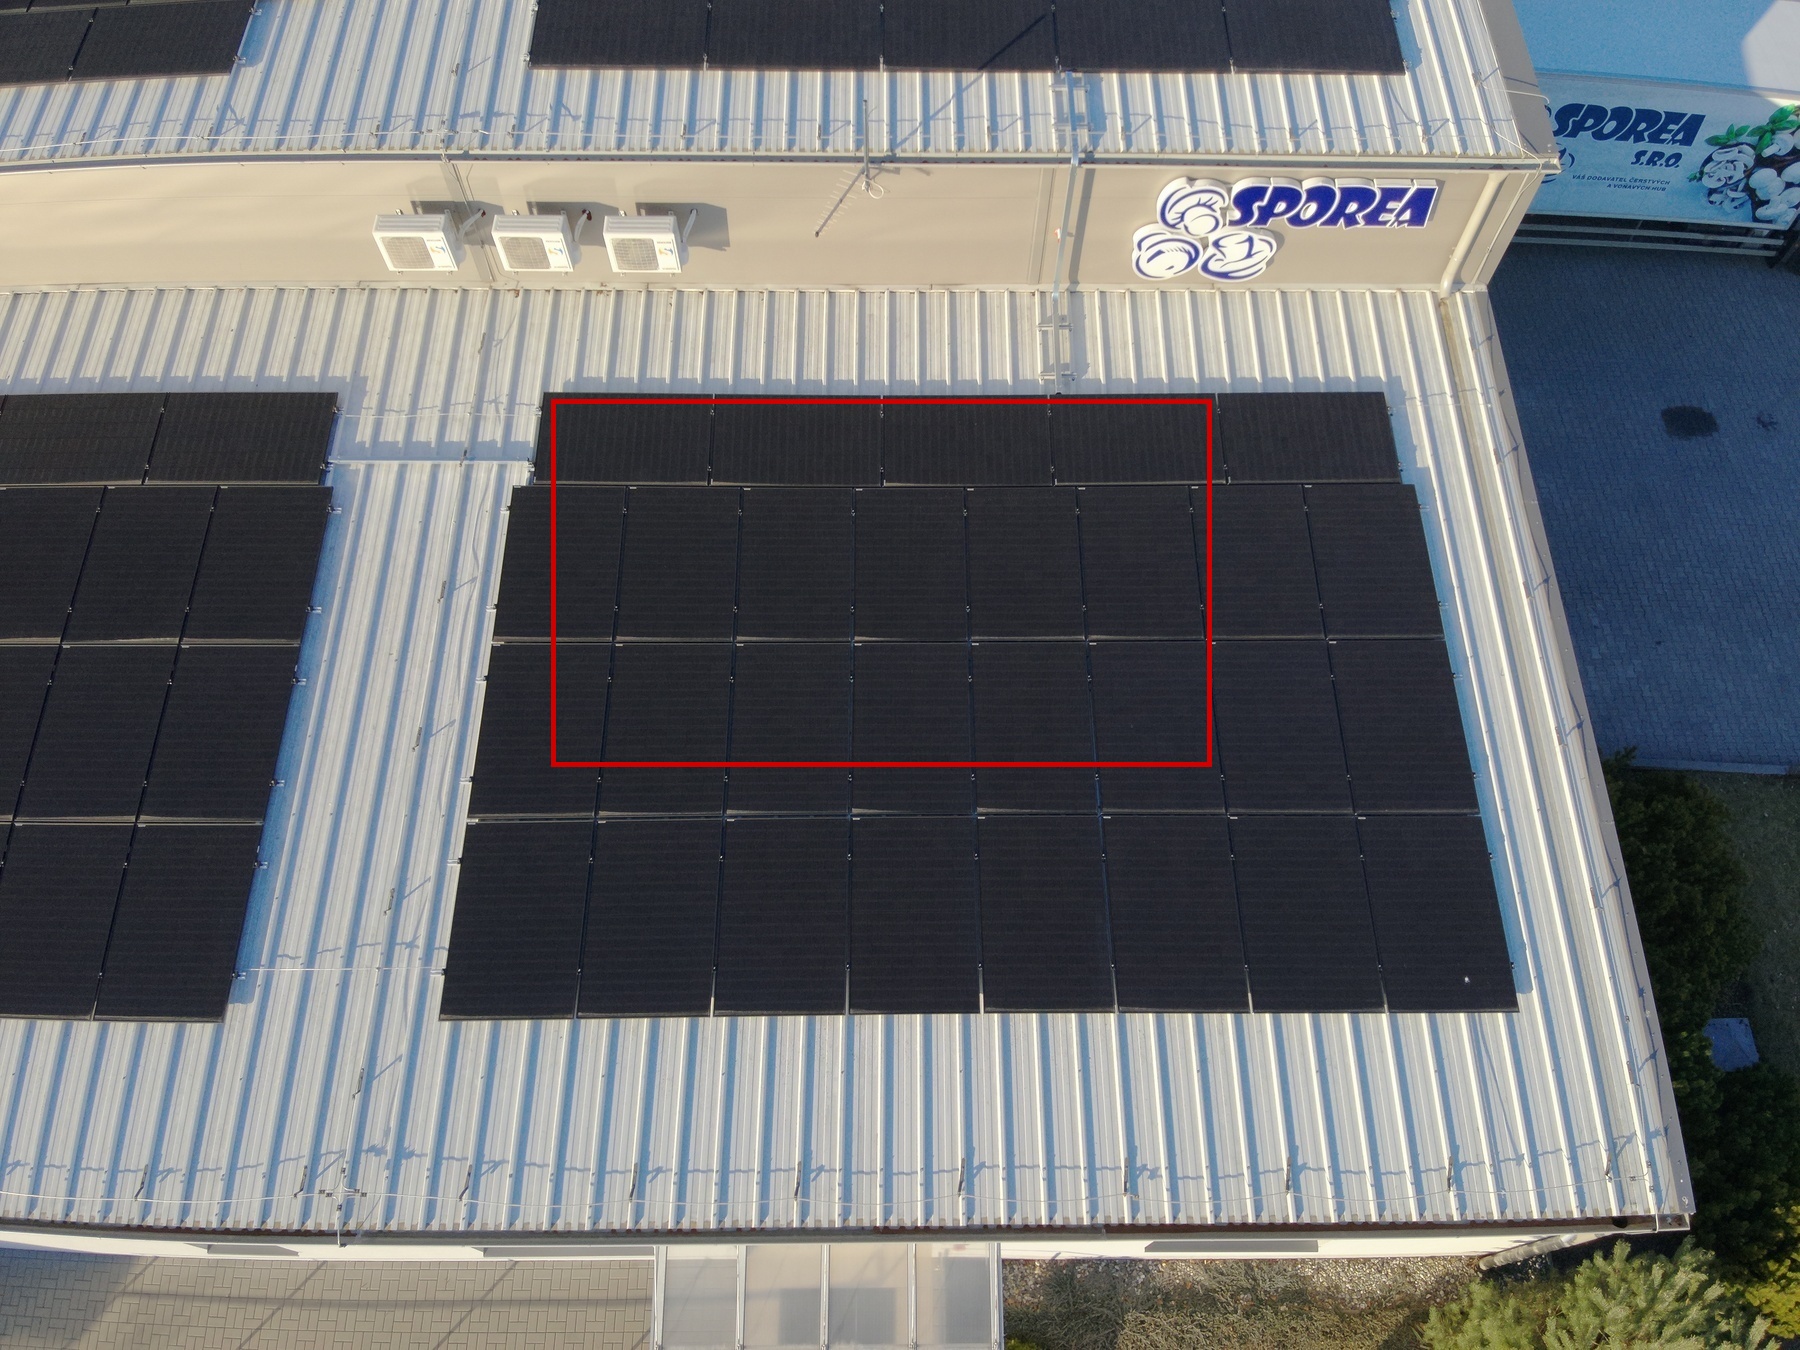
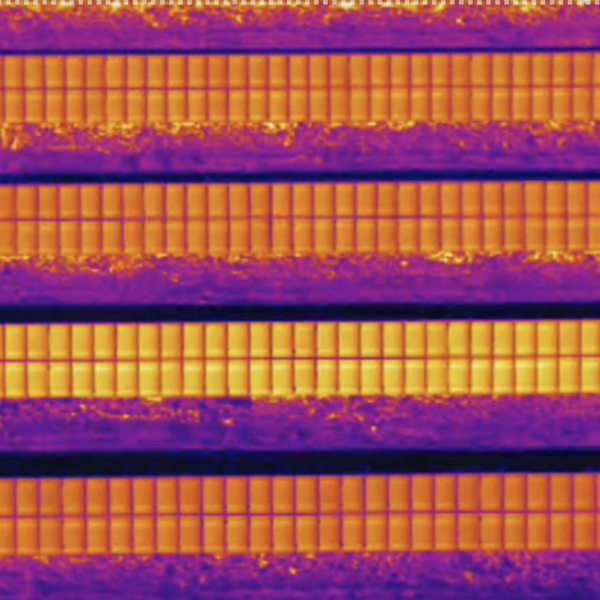
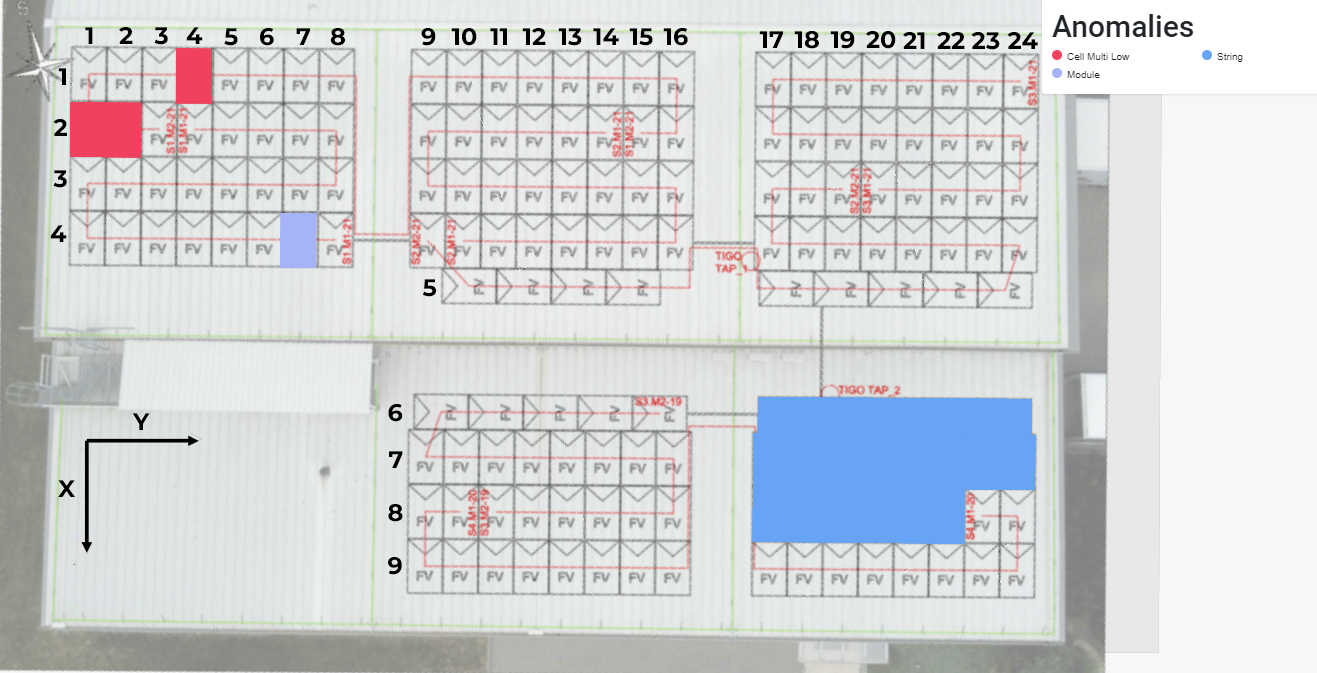
The analysis was further supported by comprehensive evaluation of aerial images with very high spatial resolution (3 cm/px), which made it possible to identify anomalies at the level of strings, modules, and even single PV cells.
To ensure maximum data integrity and accuracy, all acquired data (RGB color images and infrared IR images) were manually reviewed and cross-correlated, eliminating the possibility of misinterpretation.
Analyzed Anomalies
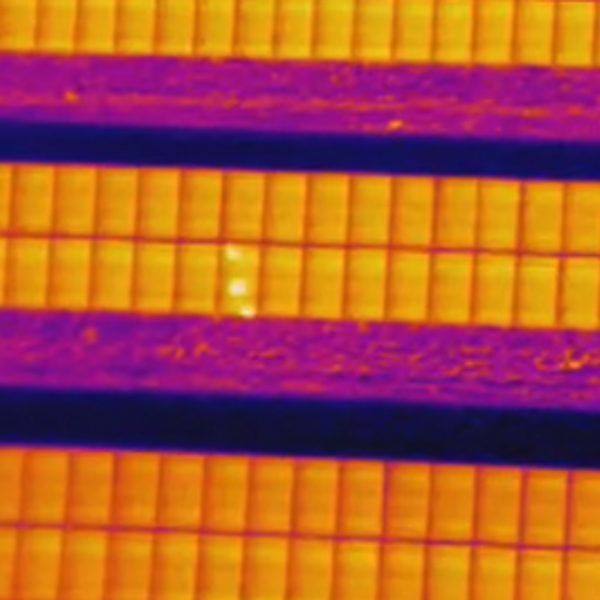
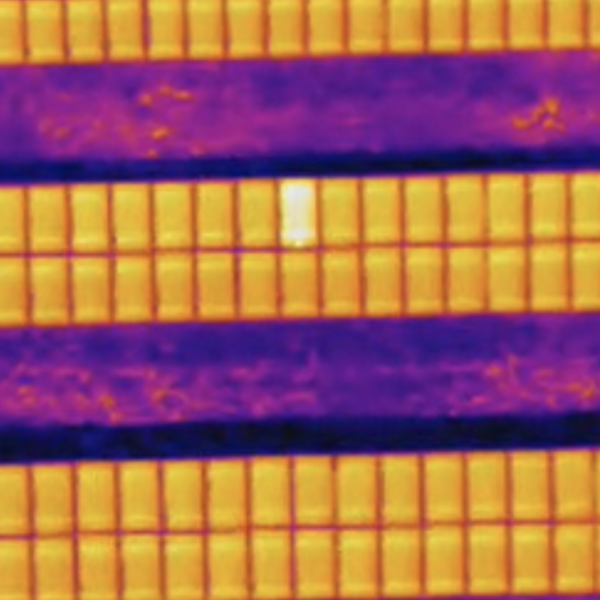
- Cell: Local thermal anomaly at the level of a single PV cell, indicating a potential defect, typically caused by manufacturing faults, material degradation, or mechanical damage.
- Cell Multi: Multiple thermal anomalies distributed across several adjacent cells of one module, often signaling a more extensive structural defect or degradation.
- Circuit: Fault in the electrical circuit, manifested by outage or underperformance of multiple strings, related to connection or insulation issues.
- Combiner: Anomaly caused by a defect at the point of combining multiple strings into one DC flow, often linked to poor connections, cable degradation, or failure of protective components.
- Cracking: Occurrence of micro-cracks or macro-cracks in the glass or laminated structure of the module, leading to localized overheating, reduced performance, and risk of further degradation.
- Damaged: Mechanical deformation of the module, including bending, displacement, physical damage, or extensive cracking, which may cause significant power losses and increased safety risk.
- Delamination: Separation of the glass, encapsulant, or active layer of the module, leading to degradation of protective properties, higher susceptibility to moisture ingress, and reduced performance.
- Diode: Activation of a bypass diode as a result of a failed cell or module, indicating the presence of a serious localized defect affecting part of the production chain.
- Helix Damage: Permanent deformation of modules or supporting structures caused by mechanical twisting of the tracker, usually due to a malfunction in movement control.
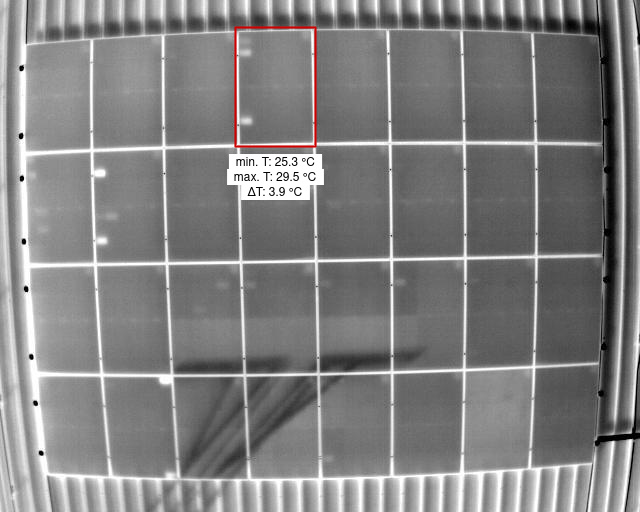
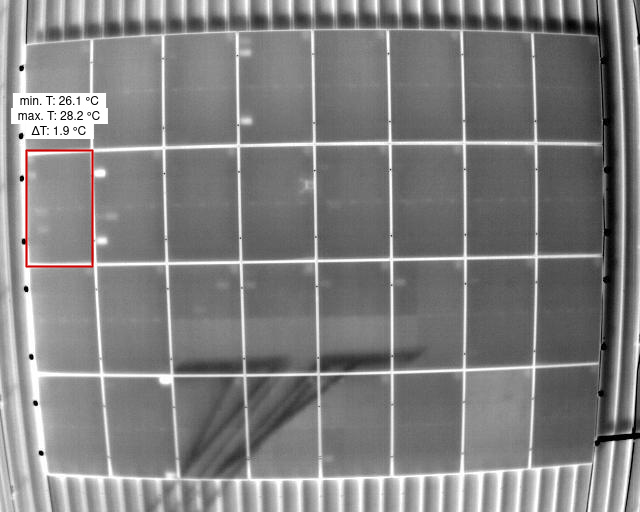
- Hot Spot: Small area with significantly higher temperature compared to its surroundings, indicating faulty connections, cell degradation, or partial shading, with a high risk of further defects.
- Hot Spot Multi: Occurrence of multiple hot spots within a single module, typically in thin-film panels, indicating more extensive structural damage.
- Internal Short Circuit: Anomaly resulting from an internal short circuit in the module, causing localized heating and significant performance reduction.
- Inverter: Malfunction of the inverter converting DC into AC current, manifested by non-functionality of connected strings and affecting large parts of the system.
- Junction Box: Thermal anomaly at the connection point of strings on the module, often indicating faulty joints, corrosion damage, or overheating of electrical contacts.
- Missing Module: Physically absent module that was documented as installed according to project records, or removed without documentation update.
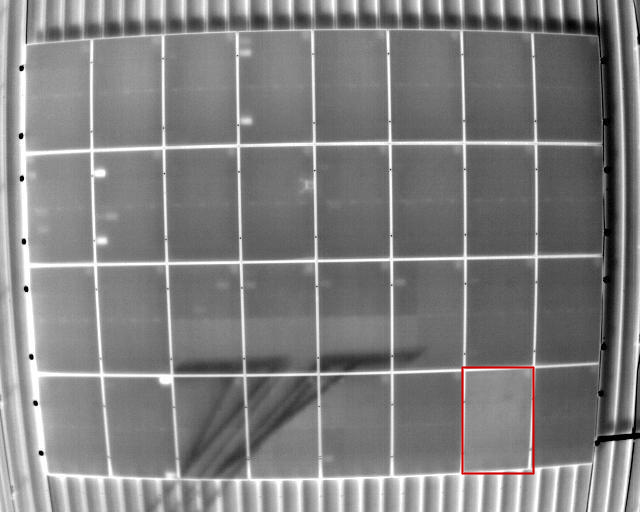
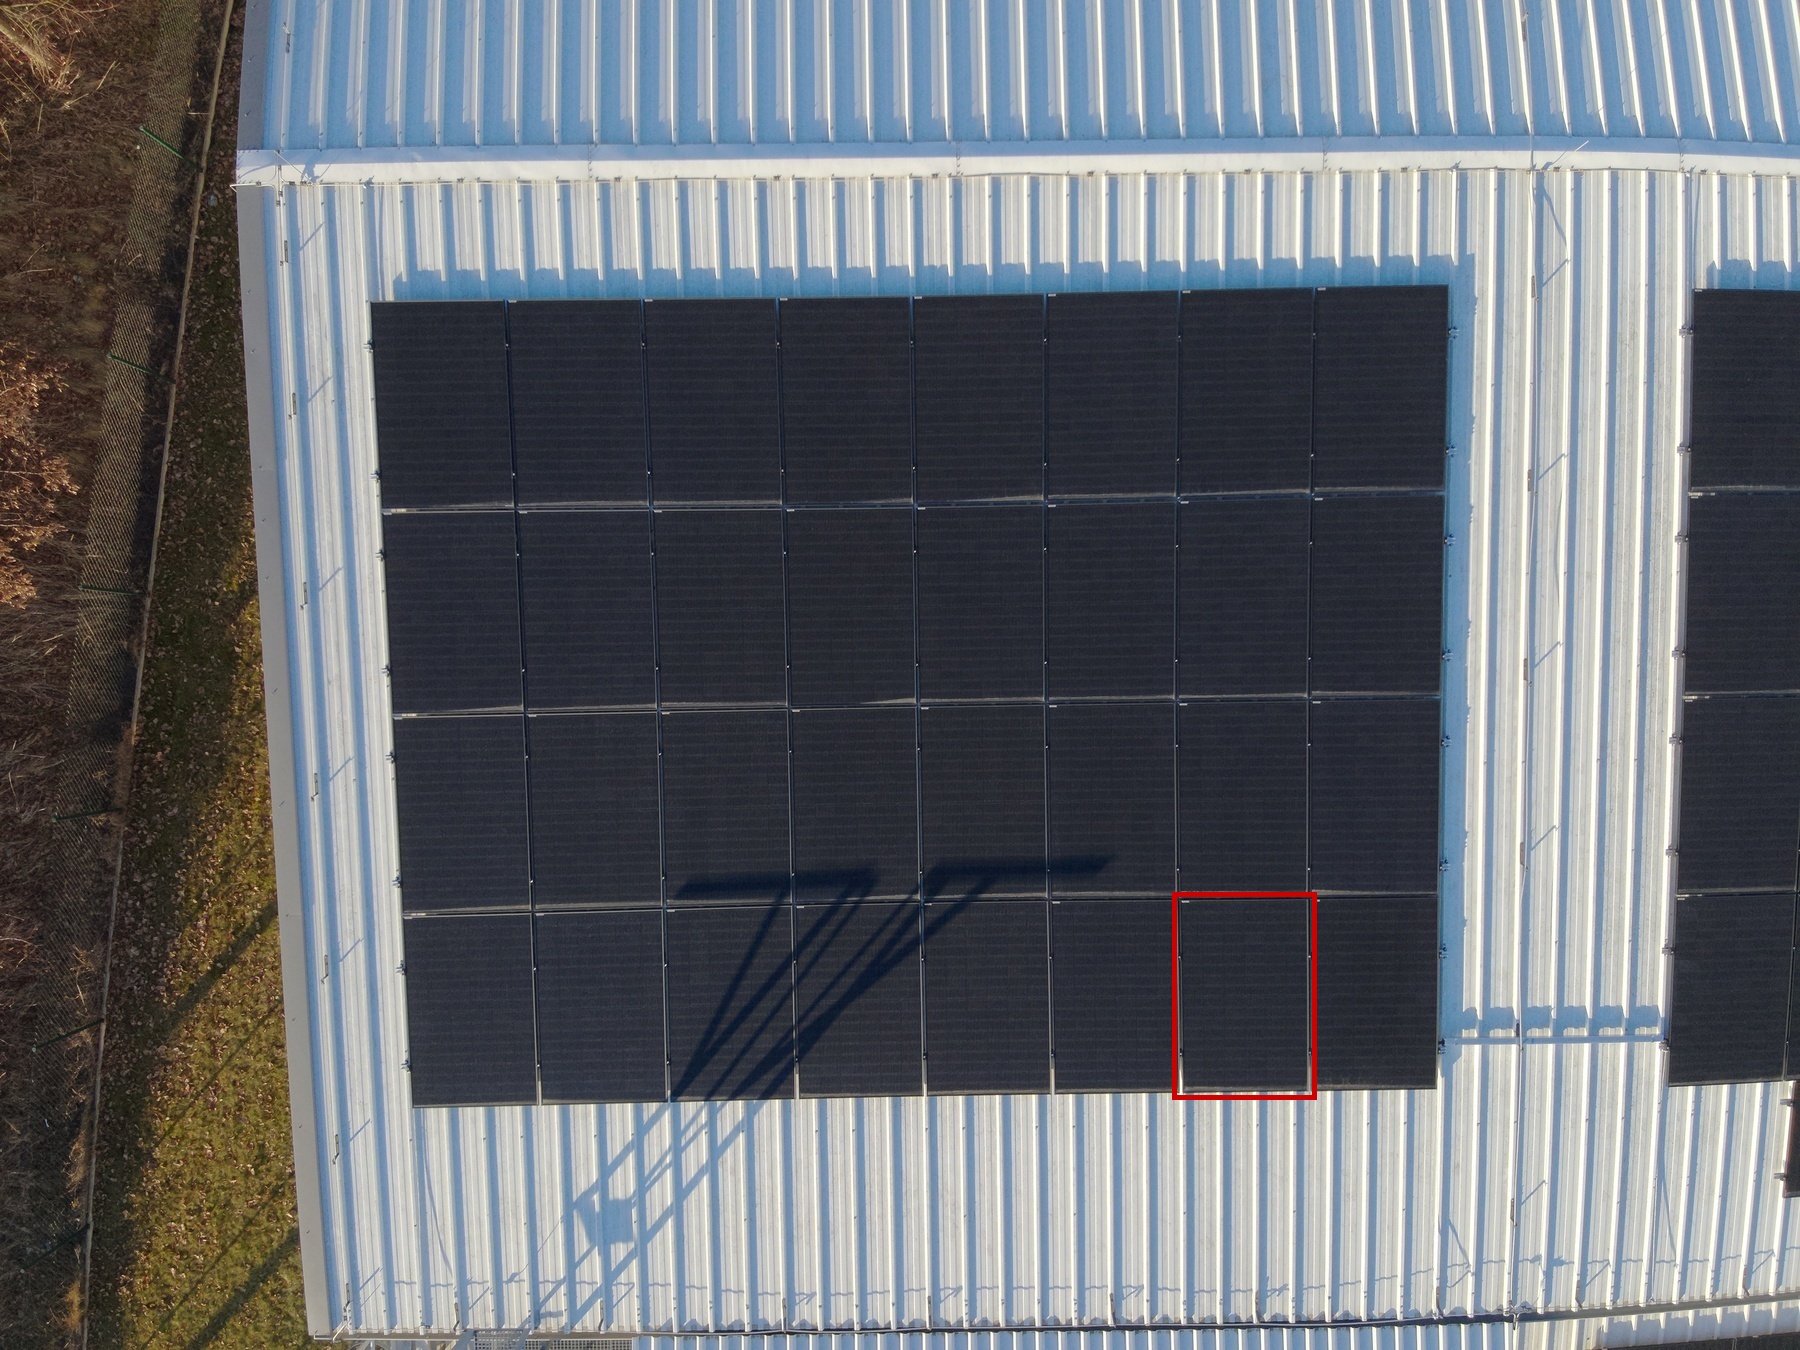
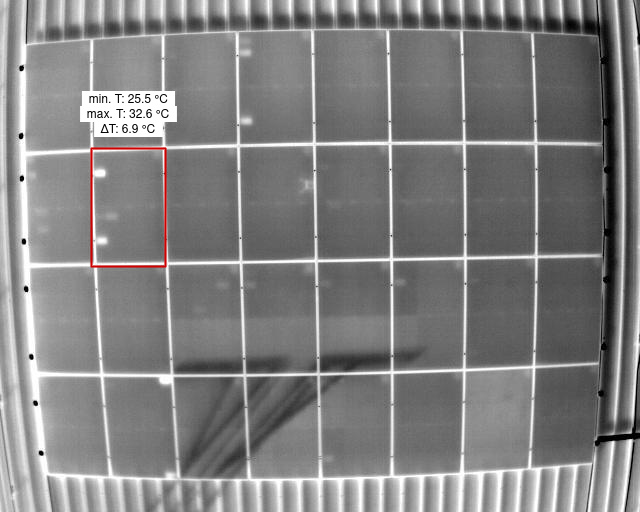
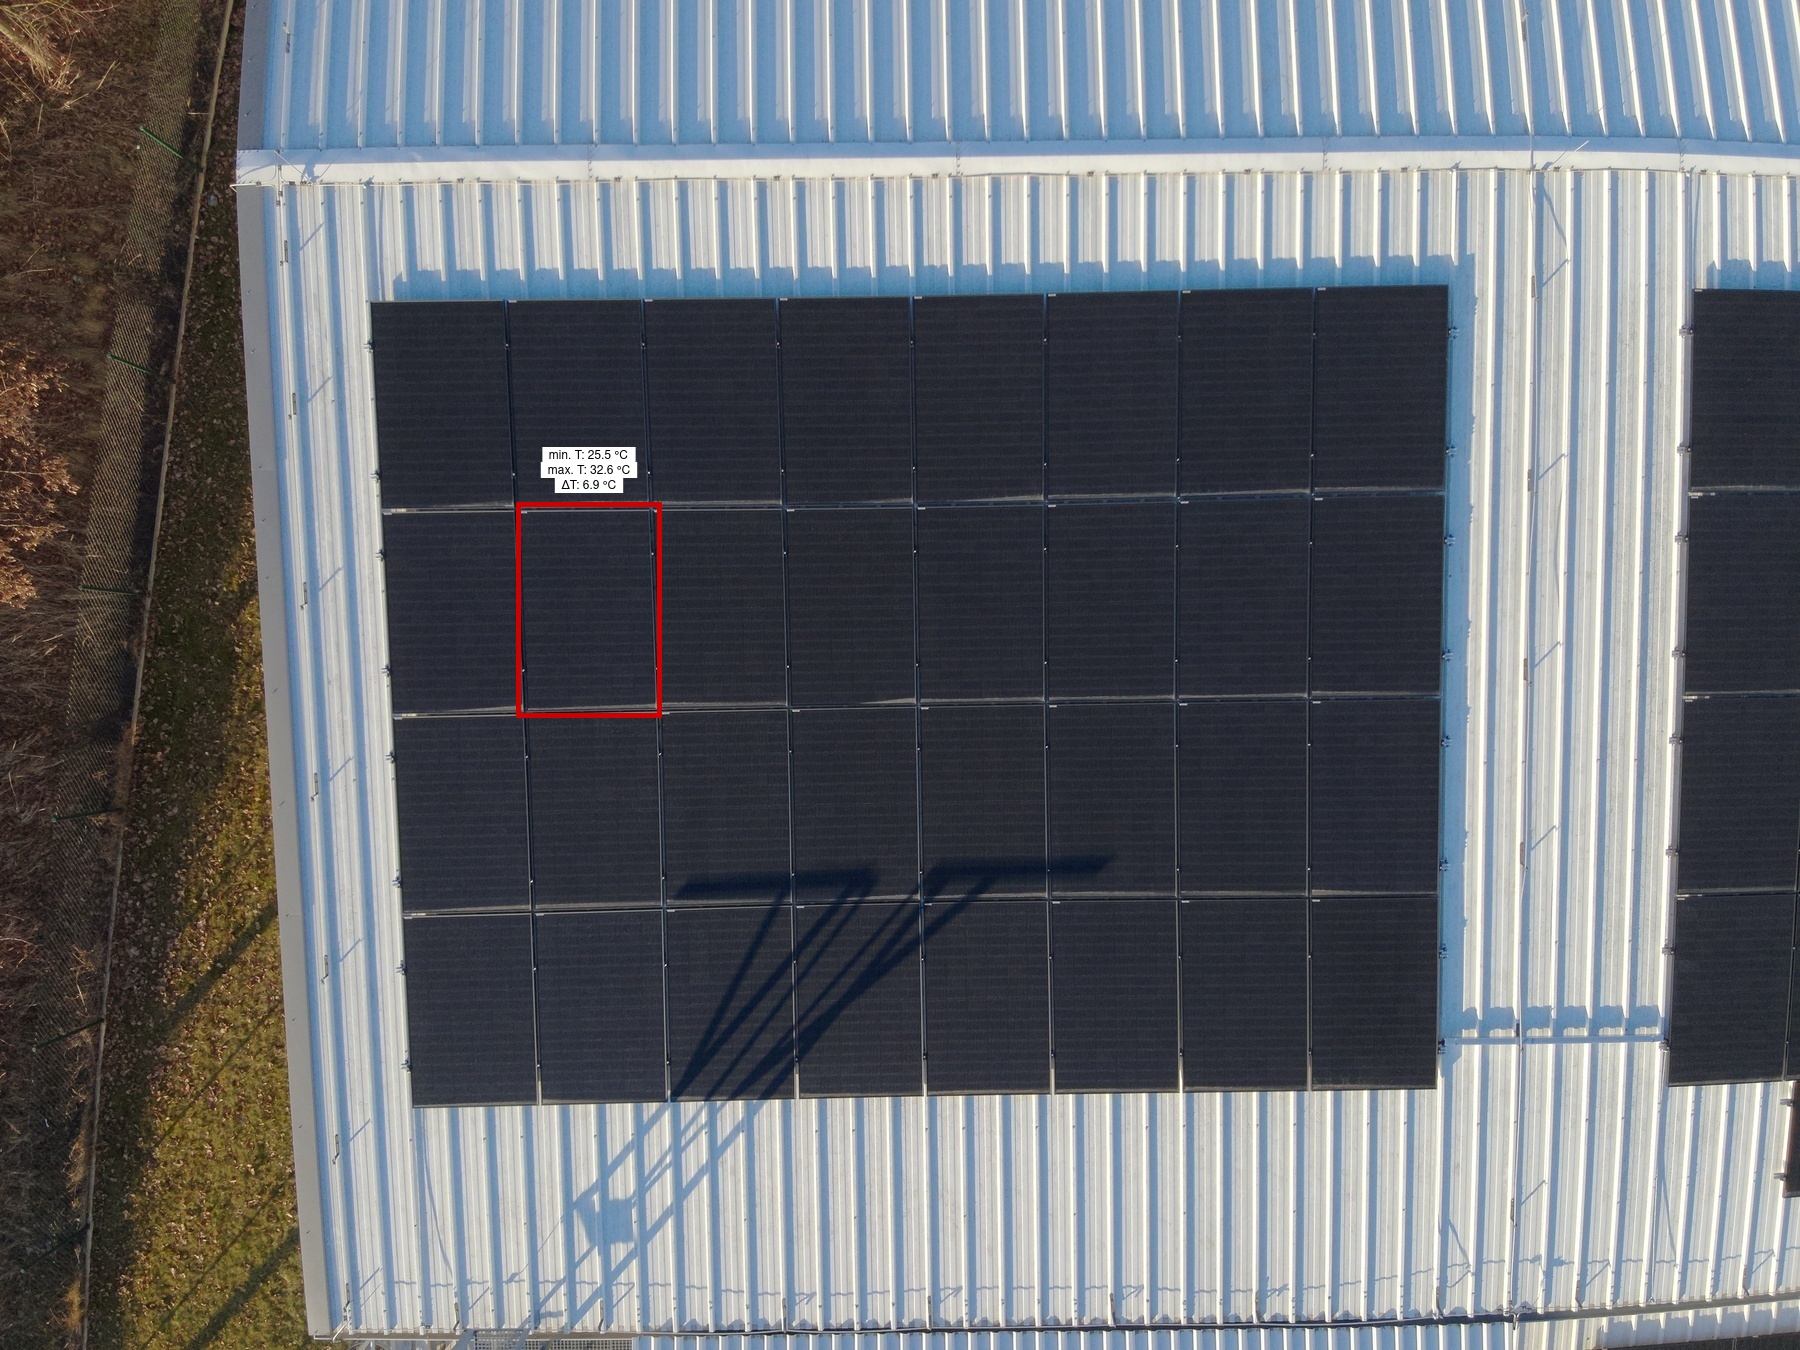
- Module: Overall thermal anomaly at the level of the entire module, often indicating bypass diode failure, internal damage, or degradation of the whole unit.
- Physical Obstruction: Presence of a foreign object (e.g., leaves, stones, snow) on the panel surface causing shading and localized performance loss.
- Reverse Polarity: Electrical connection with incorrect polarity, leading to power loss, potential equipment damage, and fault risk.
- Shading: Blocking of solar irradiance by vegetation, structures, or other objects, directly reducing energy production efficiency.
- Soiling: Accumulation of dust, dirt, bird droppings, or other debris on the panel surface, causing uneven irradiance and reduced performance.
- String: Set of PV modules connected in series, where faults in individual modules or connections affect the performance of the entire group.
- Tracker Tilt: Incorrect tracker angle setting, reducing the system’s ability to optimize energy production during the day.
- Underperforming String: String showing significantly lower temperature difference (and thus output) compared to neighboring strings, usually indicating partial defects.
- Vegetation: Shading of modules by vegetation (grass, shrubs, trees), reducing direct solar irradiance and system efficiency.